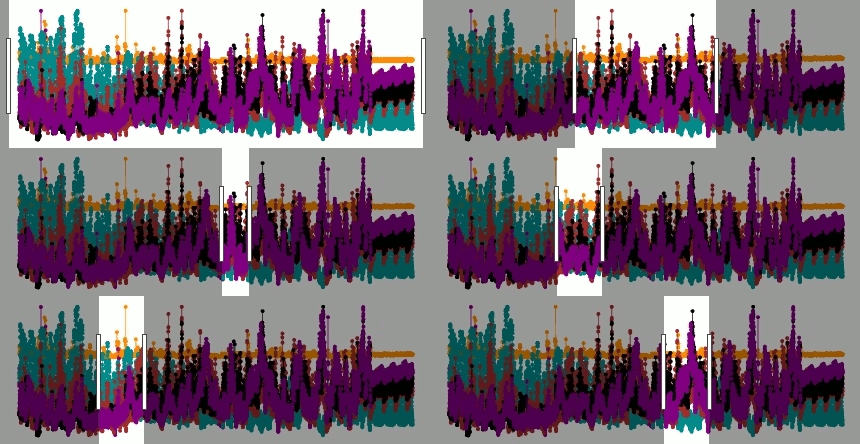
— SWDchallenge@2019-09 : visualize uncertainty —

Explore polluants through time and geolocation in France, visualize  +
+  levels and identify
![]() Official dataset from data.gouv.fr opendata platform
Official dataset from data.gouv.fr opendata platform
| Polluant list | Timeline "screenshot demo" | Timeserie of past |
|---|---|---|
|
|
|
![]() Compute outputs.
Compute outputs.
Raw dataset
-----------
Parse [468] xml files, [10] csv files
No CVS entry stations [{'FR41060', 'FR12085', 'FR36032', 'FR20077', 'FR25053', 'FR29441', 'FR10017', 'FR21037', ...}]
No CVS entry sampling points [{'SPO-FR20077_8', 'SPO-FR07051_7', 'SPO-FR23238_1', 'SPO-FR20070_8', 'SPO-FR05083_8', ...}]
No data sampling points [['SPO-FR24039_5', 'SPO-FR03071_6001', 'SPO-FR38009_8', 'SPO-FR34025_8', 'SPO-FR33201_5', ...]]
Number of values not verified [0], not validated [98066], no coords [140994], polluant not in shortlist [0]
Number of values [2211288], duplicate values [5045682] with error [15667]
Polluant list [[['8', 'Nitrogen dioxide (air)'],
                ['1', 'Sulphur dioxide (air)'],
                ['5', 'Particulate matter 10 µm (aerosol)'],
                ['7', 'Ozone (air)'],
                ['6001', 'Particulate matter 2.5 µm (aerosol)'],
                ['10', 'Carbon monoxide (air)']]]
Compute dataset
---------------
INFO: Polluants [dict_keys(['1', '5', '7', '8', '10', '6001'])]
INFO: epoch [18-07-01.00:00 19-01-26.07:00 209 days], epoch [18-07-01.00:00 19-02-20.07:00 234 days]
www dataset
-----------
Météo des polluants v0.2 [19-01-11.00:00 19-01-26.07:00 15 days]
![]() Visualize and interact : www
Visualize and interact : www